Economic Data Today: September Trade Deficit Narrows to $105.0B
The U.S. goods and services trade deficit narrowed to $105.0 billion in September as exports rose $5.8 billion and imports $5.2 billion, BEA and Census say.
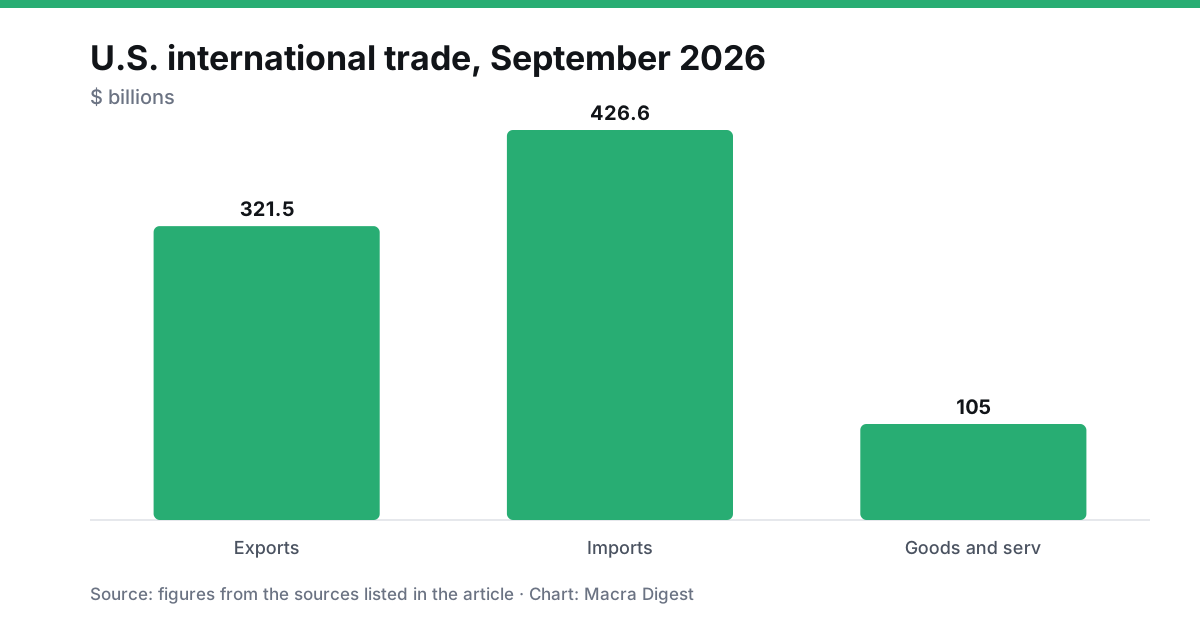
| Series (Sept. 2026, seasonally adjusted) | Level | Change from August |
|---|---|---|
| Goods and services deficit | $105.0B | -$0.7B (August revised to $105.7B) |
| Exports | $321.5B | +$5.8B (+1.9%) |
| Imports | $426.6B | +$5.2B (+1.2%) |
| Goods deficit | $135.9B | -$0.7B |
| Services surplus | $30.9B | Down less than $0.1B |
Economic data today: a smaller gap on bigger flows
The U.S. goods and services trade deficit narrowed to $105.0 billion in September, the Census Bureau and Bureau of Economic Analysis reported Wednesday. August was revised to $105.7 billion. Exports and imports both rose, so the narrowing came from a slightly larger export gain, not from weaker trade.
The goods deficit fell $0.7 billion to $135.9 billion. The services surplus eased by less than $0.1 billion to $30.9 billion.
Exports
Goods exports rose $5.1 billion to $211.0 billion. Capital goods added $3.8 billion, with computers up $1.3 billion, computer accessories up $0.8 billion and civilian aircraft up $0.7 billion. Foods, feeds and beverages gained $1.9 billion on a $1.3 billion rise in soybeans. Crude oil exports rose $1.2 billion. Industrial supplies and materials fell $1.0 billion because nonmonetary gold dropped $3.4 billion.
Services exports increased $0.7 billion to $110.5 billion, led by travel.
Imports
Goods imports rose $4.4 billion to $346.9 billion. Capital goods climbed $11.6 billion, driven by computers (up $7.6 billion) and computer accessories (up $5.7 billion). Semiconductors slipped $1.2 billion. Consumer goods increased $2.4 billion, with pharmaceutical preparations up $2.9 billion. Industrial supplies and materials fell $3.7 billion, including a $2.7 billion drop in nonmonetary gold and a $1.3 billion decline in crude oil.
Services imports rose $0.8 billion to $79.7 billion.
Trend and country detail
Year to date, the deficit is $92.4 billion, or 12.2%, lower than in the same period of 2025. Exports are up $297.3 billion (11.6%) and imports are up $204.9 billion (6.2%). The three-month moving average tells a different story: the average deficit rose $11.3 billion to $101.2 billion for the period ending in September, and it is $36.5 billion wider than a year earlier.
On a Census basis, the real goods deficit, measured in 2017 dollars, increased $3.5 billion, or 3.0%, to $119.5 billion, compared with a 2.2% rise in the nominal figure.
By country, the largest September goods deficits were with Mexico ($28.7 billion), Vietnam ($25.3 billion), Taiwan ($21.9 billion) and China ($17.9 billion). The Taiwan gap grew $3.6 billion and the European Union gap grew $3.2 billion to $14.2 billion. The Canada deficit shrank $2.7 billion to $4.4 billion.
Surpluses, revisions and averages
The United States ran goods surpluses with the Netherlands ($7.7 billion), South and Central America ($6.2 billion) and the United Kingdom ($3.0 billion). Within the larger deficits, Taiwan exports rose $0.6 billion to $5.3 billion while imports rose $4.2 billion to $27.3 billion. Exports to the European Union fell $0.6 billion to $39.0 billion as imports rose $2.6 billion to $53.2 billion. Canada saw exports slip $0.3 billion to $29.7 billion and imports fall $3.0 billion to $34.1 billion.
August figures were revised: goods exports up $0.2 billion, services exports up $0.3 billion, goods imports up $0.2 billion and services imports up $0.4 billion. On a three-month basis, average exports were $316.0 billion and average imports $417.2 billion, up $28.9 billion and $65.4 billion from a year earlier.
Next on the calendar
The October report is due Tuesday, Dec. 8. Trade balances feed the GDP report through net exports; BEA replaces nonmonetary gold trade with its own adjustment when it builds the national accounts.
Prepared with AI assistance from public sources and reviewed under our editorial policy. Not investment advice.